cPanel & WHM Server Monitoring: Tools for better control
An influential IBM® engineer once said that measurement is the first step towards control and improvement. He was talking about business systems, but it’s just as valid for servers. You can’t control or improve web hosting operations without monitoring, which is why cPanel & WHM is packed with tools to give you insight into your server’s hardware and software.
This article will show you how cPanel & WHM’s server monitoring tools make it easy to take control and diagnose issues quickly.
How to Check Your Server’s Status in cPanel & WHM
The most important monitoring tools are helpfully arranged under the Server Status item in WHM’s sidebar menu.
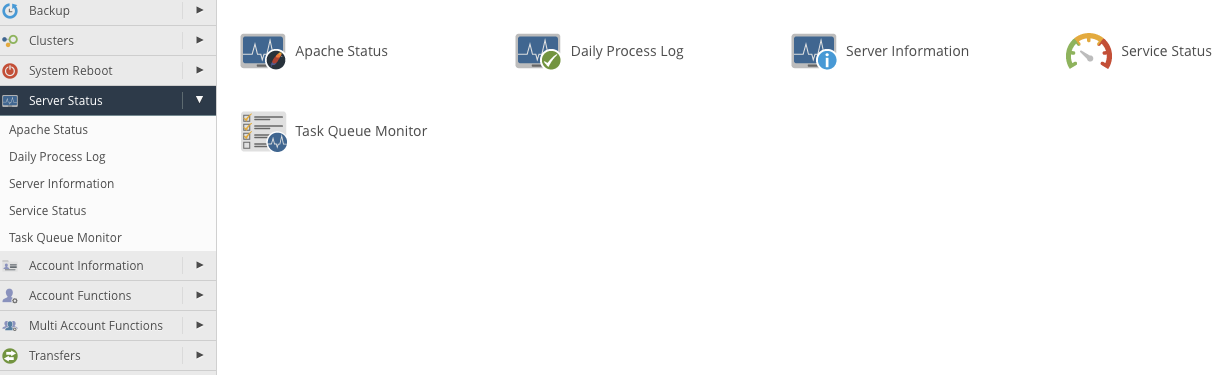
Here, you can find out about resource consumption, the health of individual services, and everything you need to know about what your server is doing behind the scenes.
Let’s take a look at each of the menu items in turn.
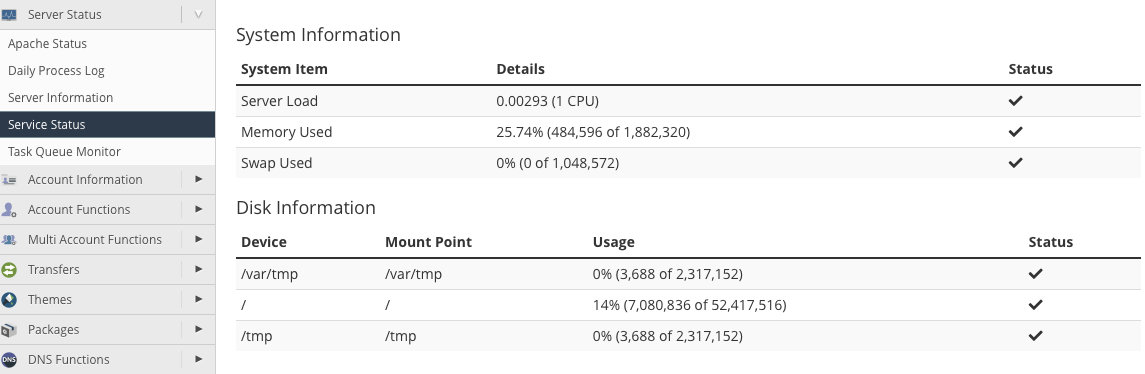
Server Information
The Server Information page displays basic data that includes hardware and details about resource consumption.
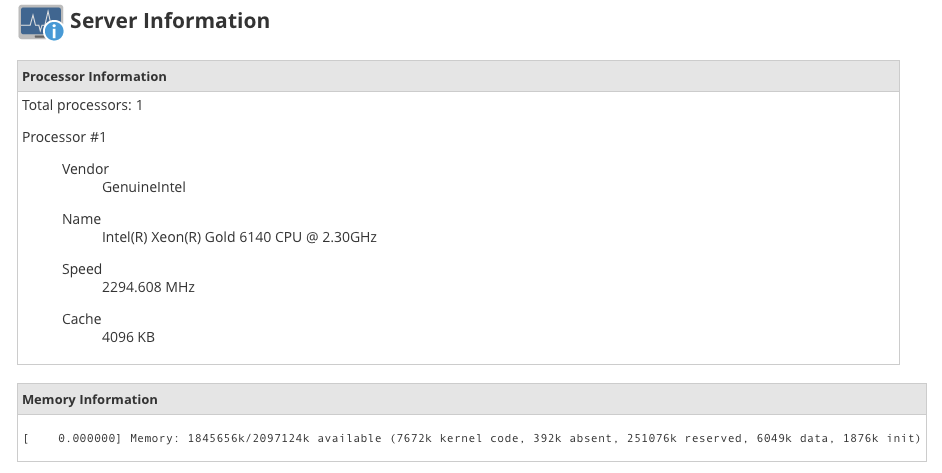
This page should be your first port of call when you need a quick health overview. It shows how much memory and storage is available and how much is being used.
Apache Server Status
The Apache web server is a critical component of your web hosting operation, so we display a comprehensive selection of performance and status information on a single page.
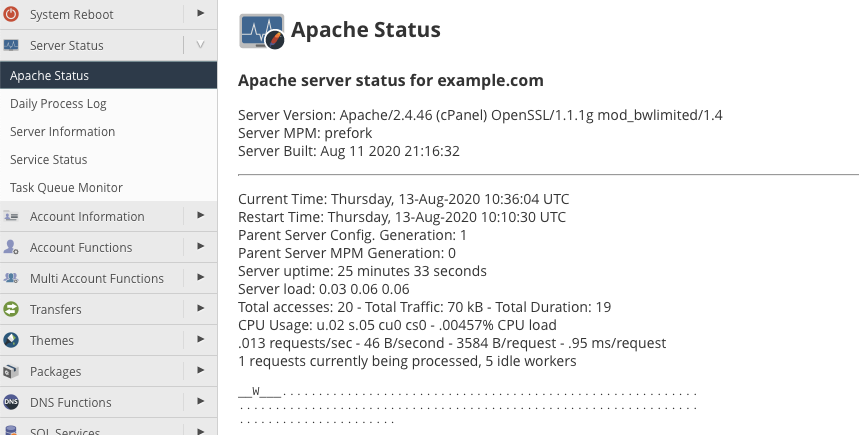
You can see uptime and load averages, the number of requests, and their status. Apache Server Status is an incredibly useful diagnostic tool when users report website performance issues and latency issues.
Daily Process Log
The Daily Process Log displays the resources consumed by users and processes during the current day and for 24-hour periods in the past.
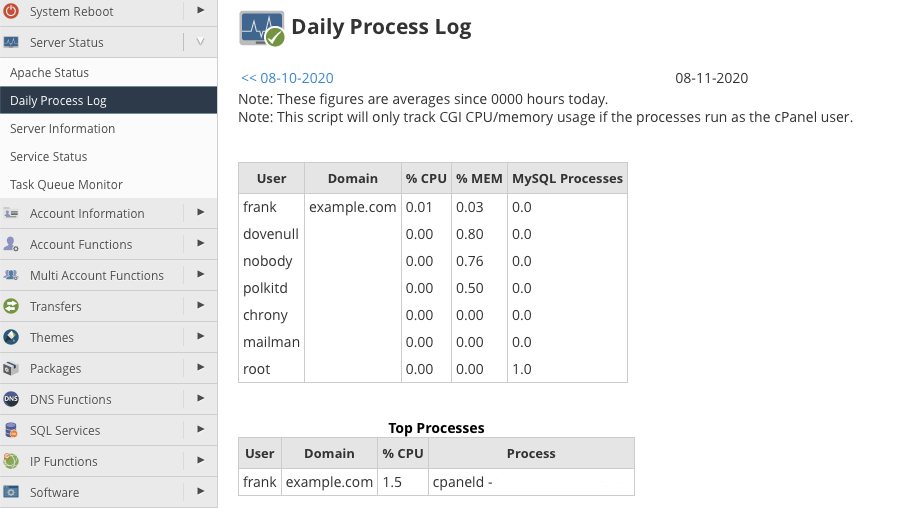
This is where you should head to find clues about the causes of performance or resource contention issues. It reveals at a glance which user is consuming the most resources and which of their processes is the culprit.
Service Status
A server may run dozens of services, the software responsible for everything from DNS lookups to log management and email delivery. The Service Status page allows you to monitor their condition to see whether they are running as expected.
Task Queue Monitor
The task queue is a list of tasks running right now or waiting to run. Task Queue Monitor tells you what the machine is doing and what it plans to do soon. The monitor updates in real-time and provides an invaluable moment-by-moment activity overview.
If you’d like more details about each of the tools we’ve discussed, take a look at our in-depth documentation pages.
What Are the Best Tools for Server Monitoring?
cPanel & WHM’s server monitoring tools provide all the information most administrators need, but, if you prefer a different approach, partners such as CloudLinux™ offer additional monitoring features as add-on options.
CloudLinux OS is an operating system for shared hosting providers who use cPanel & WHM. It is best known for its ability to partition resources so that each user consumes only the allotted memory, CPU, and network resources they are granted. It also includes powerful monitoring tools. This combination of granular resource allocation and rich monitoring allows shared hosting providers to make the most efficient and cost-effective use of their server.
You can buy a CloudLinux license from our extensions page.
Monitoring is the key to shipshape servers and fast issue resolution. With cPanel & WHM, all the information you need is at your fingertips, alongside our comprehensive configuration and management tools.
As always, if you have any feedback or comments, please let us know. We are here to help in the best ways we can. You’ll find us on Discord, the cPanel forums, and Reddit.